Table of Contents
QuickBooks Reporting Basics
Overview
QuickBooks offers a variety of reporting tools to help businesses track and analyze their financial performance. Understanding the basics of QuickBooks reporting is crucial for generating accurate and insightful reports.
Types of Reports
- Profit and Loss Statement: summarizes a period’s worth of earnings and outlays.
- Balance Sheet: shows the equity, liabilities, and assets at a certain moment in time.
- Cash Flow Statement: Shows cash inflows and outflows.
- Sales Reports: Provide detailed information on sales activity.
- Expense Reports: Tracks business expenses, helping identify cost-saving opportunities.
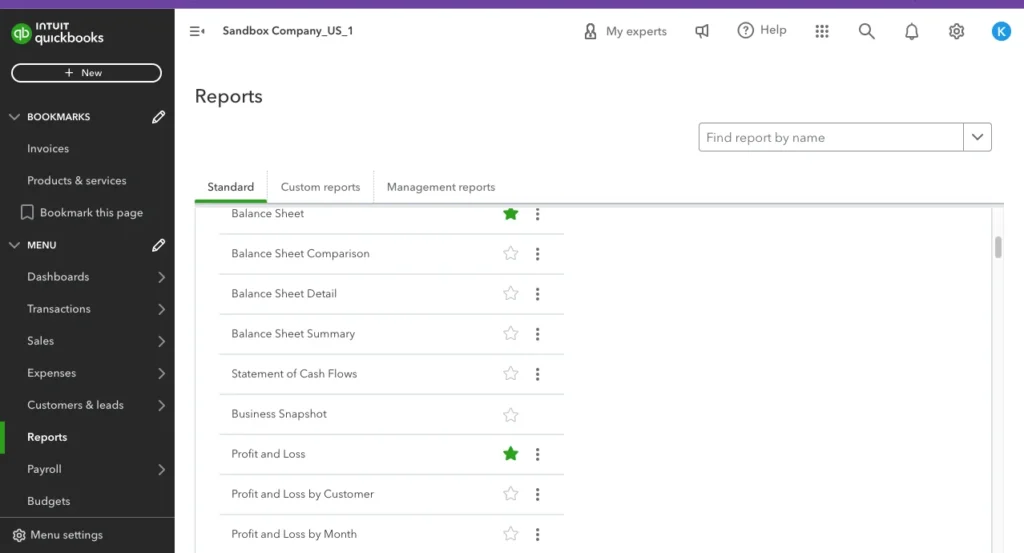
ccessing Reports
Navigate to the Reports menu in QuickBooks to access the wide array of standard reports available. This section will guide you through selecting and generating basic reports.
Customization Basics
Before diving into advanced techniques, familiarize yourself with basic customization options. Modify the date range, sort by various parameters, and apply basic filters to narrow down the data.
Customizing Reports in QuickBooks
Customization Options
QuickBooks allows users to customize reports to meet specific business needs.
- Filters: To include or exclude particular data, apply filters.
- Display Options: Change the display format of reports, such as date range and columns.
- Headers and Footers: For a polished appearance, modify the headers and footers.
Step-by-Step Customization
- Access Report: Navigate to the report you want to customize.
- Use Filters: Apply necessary filters to narrow down the data.
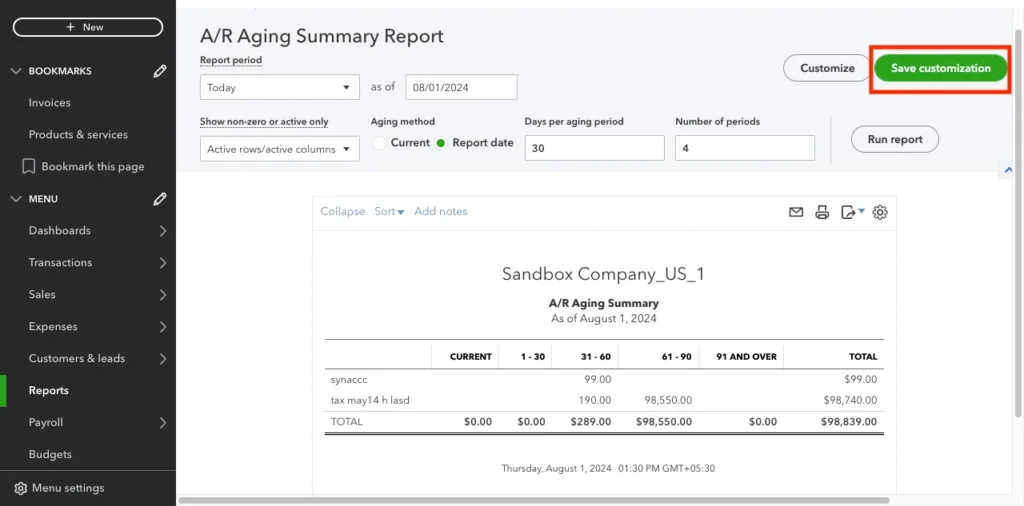
- Adjust Display: Modify columns, date ranges, and sorting options.
- Save Customizations: Save the customized report for future use.
Adding Custom Fields
Add custom fields to your reports to capture specific data points that are unique to your business. Custom fields can provide insights into areas that standard reports might not cover.
Advanced Filtering and Sorting
Filtering Techniques
Advanced filtering allows for more precise data analysis.
- Date Filters: Filter data by specific date ranges.
- Transaction Types: Filter by different types of transactions, such as invoices or payments.
- Custom Filters: Create custom filters to focus on specific data points like customer locations or payment methods.
Sorting Options
Sorting helps organize data for better readability.
- Alphabetical Sorting: Sort data alphabetically for easier reference.
- Numerical Sorting: Sort data by numerical values, such as amounts or quantities.
- Hierarchical Sorting: Sort data by hierarchical categories to understand relationships between data points.
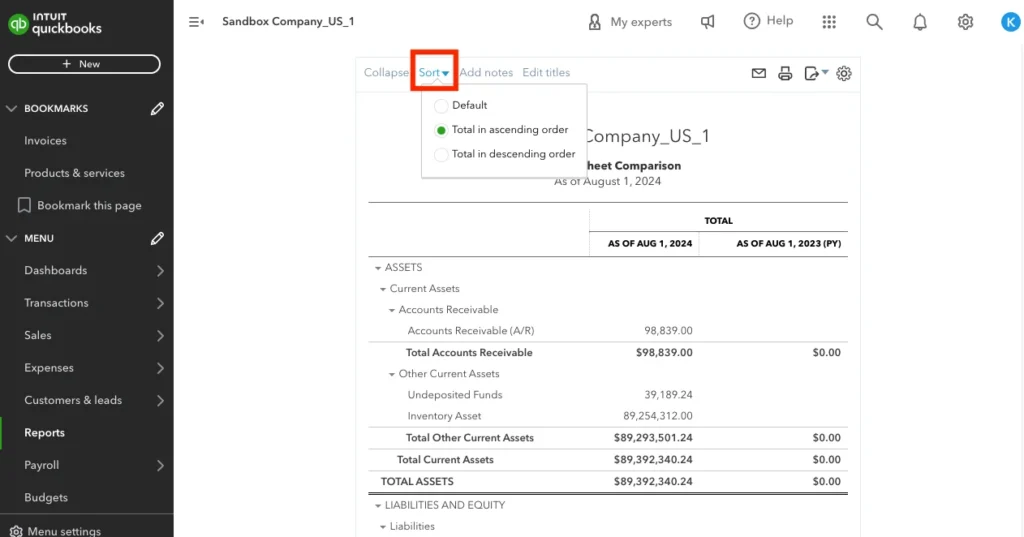
Multi-Level Sorting
Use multi-level sorting to sort by multiple fields simultaneously. For example, sort by customer and then by date within each customer to get a detailed chronological view of transactions.
Grouping and Subtotaling Data
Benefits of Grouping
Grouping data in reports can highlight specific aspects of your business.
- By Customer: Group sales data by customer to see who your top clients are.
- By Product/Service: Group by product or service to identify bestsellers.
- By Department: Group expenses by department to analyze departmental spending.
Subtotaling
Subtotaling within groups provides a clearer picture of financial performance.
- Subtotal by Category: Add subtotals for categories such as expenses or revenue.
- Custom Subtotals: Create custom subtotals to match specific business needs.
Nested Grouping
Implement nested grouping to analyze data across multiple dimensions. For example, group sales by region and then by product within each region to get a detailed view of regional performance.
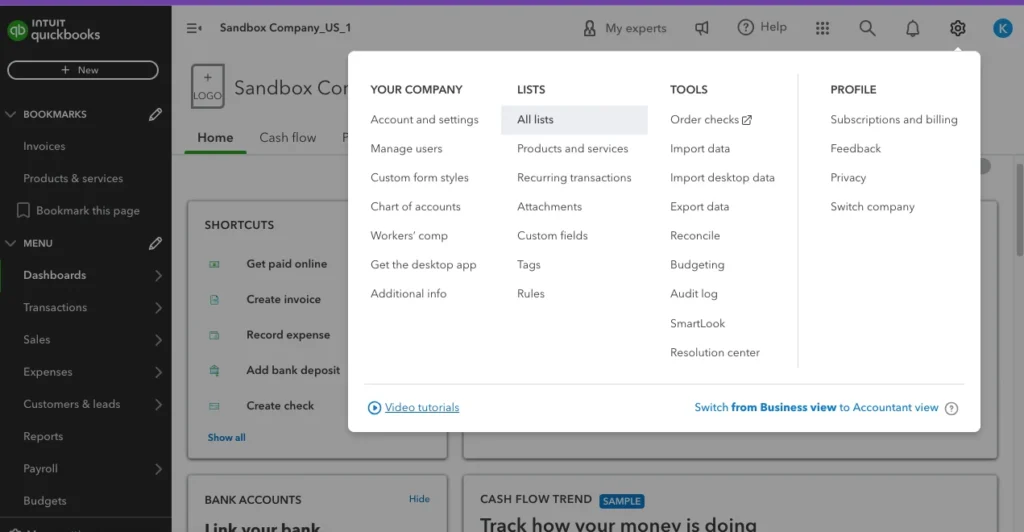
Utilizing Classes and Locations
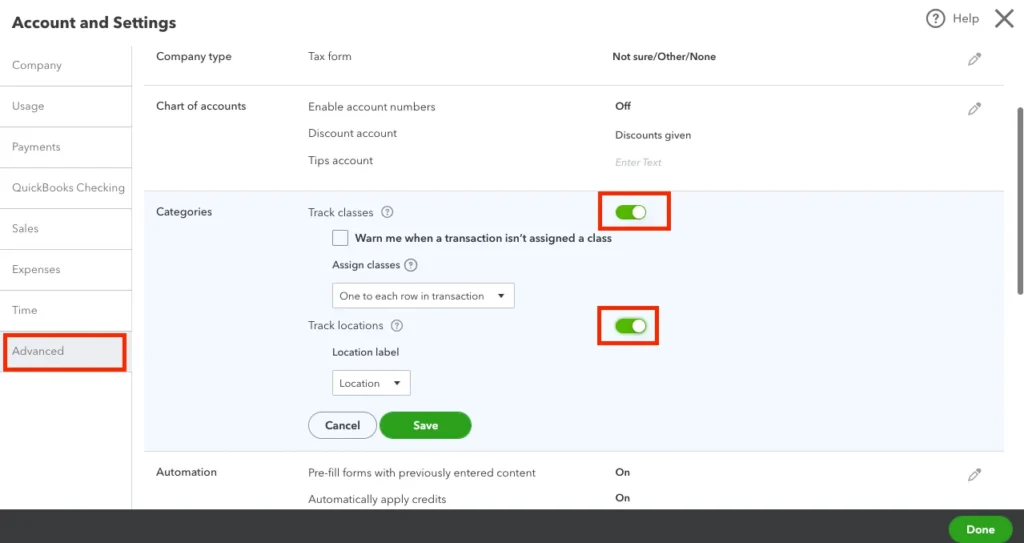
Class Tracking
Classes in QuickBooks help segment data for more detailed reporting.
- Set Up Classes: Create classes for different departments or product lines.
- Assign Classes: Assign classes to transactions for segmented reporting.
Location Tracking
Track financial data by location to understand performance across different sites.
- Set Up Locations: Define locations for your business operations.
- Assign Locations: Assign transactions to locations for location-specific reports.
Class and Location Reports
Generate class and location-specific reports to compare performance across different segments. This helps in identifying high-performing areas and those needing improvement.
Memorizing and Scheduling Reports
Memorizing Reports
Memorizing reports in QuickBooks saves time by allowing you to quickly access frequently used reports.
- How to Memorize: After customizing a report, click “Memorize” to save the settings.
- Accessing Memorized Reports: Find memorized reports under the “Reports” menu.
Scheduling Reports
Set up schedules for automatic report generation and delivery.
- Set Up Schedule: Define the frequency and recipients for scheduled reports.
- Automated Delivery: Reports are automatically sent to specified recipients.
Recurring Reports
Create recurring reports for monthly, quarterly, or annual analysis. This ensures that you and your team always have up-to-date financial information without manual intervention.
Insights from Dashboard Reporting
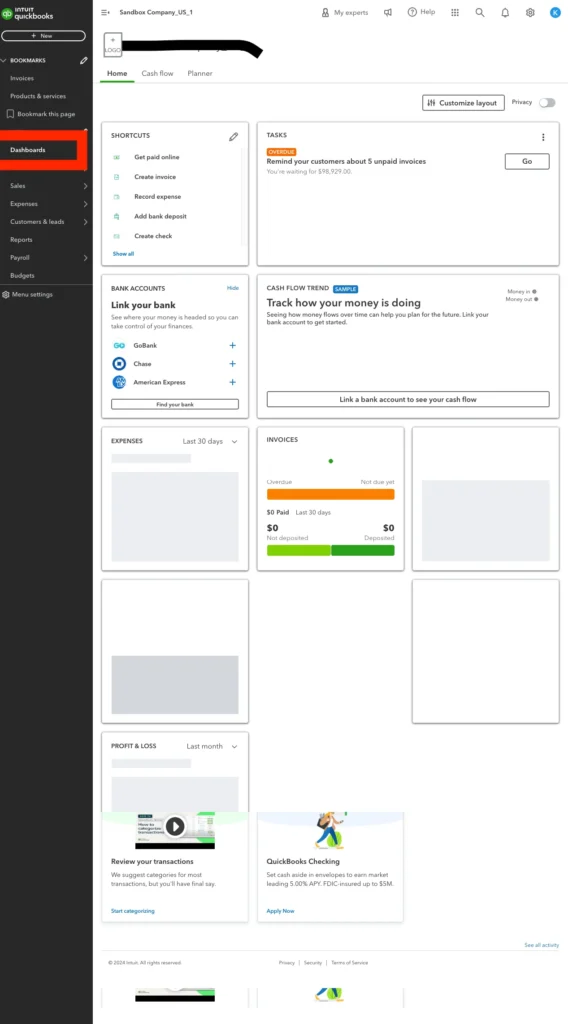
QuickBooks Dashboards
Dashboards provide a visual overview of your business’s financial health.
- Custom Dashboards: Create custom dashboards to display key metrics.
- Real-Time Data: Dashboards update in real-time for up-to-date insights.
Key Performance Indicators (KPIs)
Track important KPIs directly from the dashboard.
- Sales Metrics: Monitor sales performance and trends.
- Expense Metrics: Keep an eye on expenses to control costs.
Interactive Dashboards
Leverage interactive dashboards that allow you to drill down into specific data points for more detailed analysis. This interactive capability provides deeper insights and helps in making data-driven decisions.
Integrating Excel for Advanced Analysis
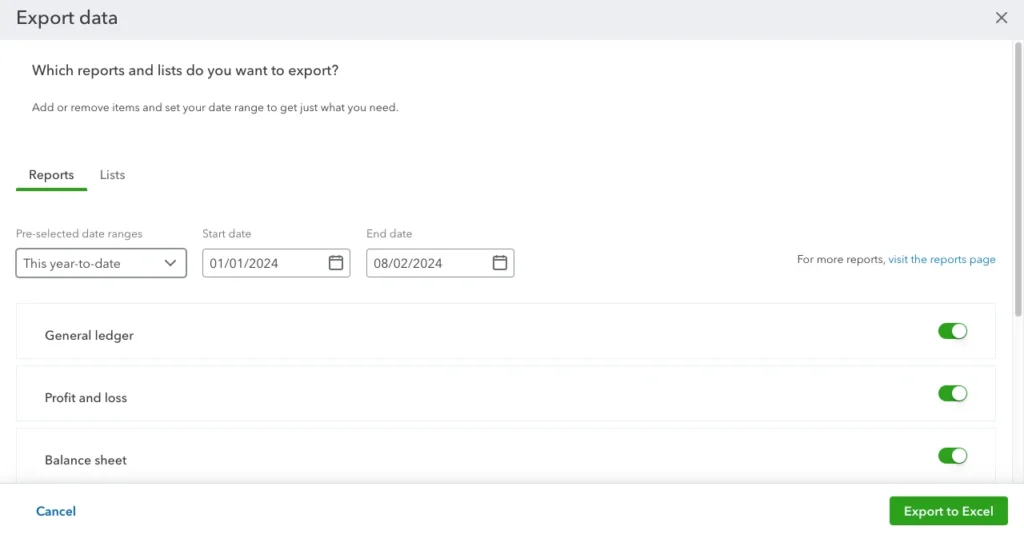
Exporting Data
QuickBooks allows you to export data to Excel for advanced analysis.
- How to Export: Use the “Export” function to send report data to Excel.
- Excel Templates: Utilize pre-built templates for common analyses.
Advanced Analysis Techniques
Perform complex calculations and create custom charts in Excel.
- Pivot Tables: Use pivot tables to summarize large datasets.
- Advanced Formulas: Apply advanced formulas for deeper insights.
Data Integration
Integrate data from QuickBooks with other business systems using Excel as an intermediary. This can provide a more holistic view of your business’s financial health.
Advanced Reporting Tips and Tricks
Using Report Center
The Report Center in QuickBooks provides easy access to all available reports.
- Search Function: Use the search function to quickly find reports.
- Favorites: Mark frequently used reports as favorites for quick access.
Custom Report Builder
Leverage the custom report builder for unique reporting needs.
- Step-by-Step Builder: Follow the guided steps to create custom reports.
- Custom Fields: Add custom fields to capture specific data points.
Report Templates
Save time by using or creating report templates for recurring reports. Templates ensure consistency and save time in report generation.
Conclusion
Mastering advanced reporting techniques in QuickBooks can transform the way you analyze your business’s financial performance. From customizing and filtering reports to integrating data with Excel, these techniques offer deeper insights and more informed decision-making. Implement these strategies to elevate your financial analysis and drive business growth.
FAQs
What are the basic types of reports in QuickBooks?
QuickBooks offers profit and loss statements, balance sheets, cash flow statements, and sales reports.
How can I customize reports in QuickBooks?
You can customize reports by applying filters, adjusting display options, and customizing headers and footers.
What are the classes and locations in QuickBooks?
Classes and locations help segment data for more detailed reporting by department, product line, or business location.
How do I memorize and schedule reports in QuickBooks?
After customizing a report, use the “Memorize” function to save it. For scheduled reports, set up the frequency and recipients for automatic delivery.
Can I export QuickBooks data to Excel?
Yes, QuickBooks allows exporting data to Excel for advanced analysis using features like pivot tables and advanced formulas.